Overview
Two reports show how well your estimates turn into work. Estimate Close Ratio compares the estimates you sent with the visits scheduled from them, month by month. Time to Close Estimates shows how long customers take to accept or decline.
Click Reports in the left menu. Both reports are in the Estimates Reports section. If you renamed estimates (for example to “quotes”), the report names use your word.
Estimate Close Ratio
Pick a date range at the top. It starts on January 1 of this year and runs through today.
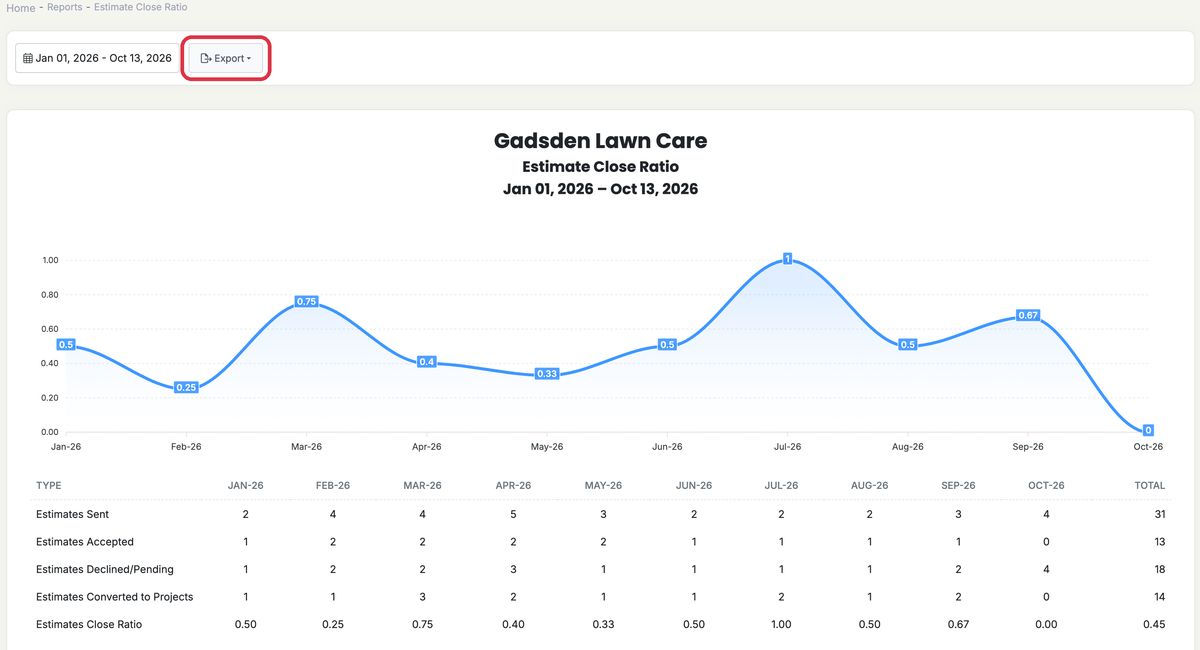
The table has a column for each month plus a Total column. Each estimate counts in the month of its estimate date. Deleted estimates and estimates that were never sent are left out.
- Estimates Sent: every sent estimate.
- Estimates Accepted: sent estimates whose status is Accepted.
- Estimates Declined/Pending: every other sent estimate. That includes declined ones and ones still waiting for an answer.
- Estimates Converted to Projects: visits scheduled from an estimate, counted by visit date. Skipped visits are left out.
- Estimates Close Ratio: Converted to Projects divided by Estimates Sent, shown as a decimal. 0.25 means 25%.
A chart above the table shows the Close Ratio for each month.
Good to know: Converted to Projects counts visits, not estimates. If one estimate becomes a recurring service, every visit in the range counts. That can push the ratio above 1.00. The last month counts visits through the end of that month, even past your end date.
To save the table, click Export and choose Excel or CSV.
Time to Close Estimates
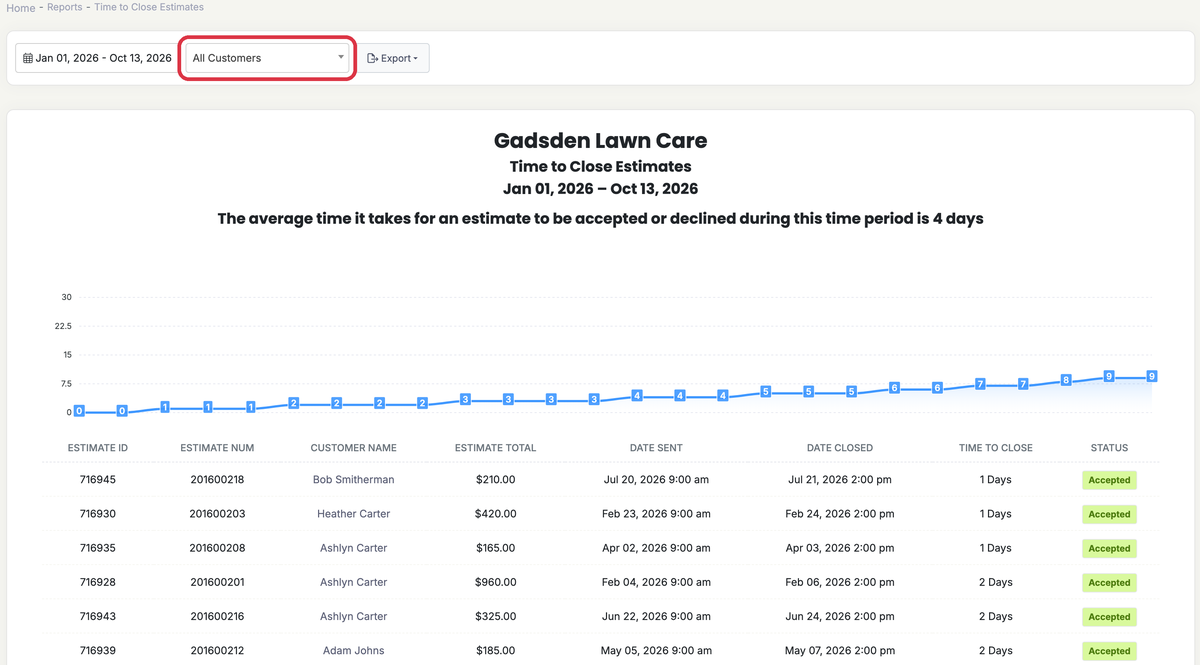
Choose a date range and a customer, or leave it on All Customers. The range uses the estimate date. The report lists sent estimates that have been accepted or declined.
At the top you’ll see the average, such as “The average time it takes for an estimate to be accepted or declined during this time period is 3 days.”
Each row shows:
- Estimate ID and Estimate Num
- Customer Name (click it to open the customer)
- Estimate Total
- Date Sent: when the estimate was emailed
- Date Closed: when it was accepted or declined
- Time to Close: the time between the two, in whole days
- Status: Accepted or Declined
The fastest estimates are listed first. A chart shows the days for each estimate. Use Export to download the list as Excel or CSV.
Who can see these reports
Admins can always open Reports. Other users need access to Reports turned on in their permissions.