Table of Contents
- Overview
- Filling in the Numbers
- Your Day’s Totals
- Your Efficiency Scores
- What Good, Fair, and Poor Mean
- Crew Hours
- Common Questions
Overview
The strip of numbers above your route map tells you two different things: what your day looks like, and how efficient it is. The first five boxes are plain totals — stops, miles, fuel, time, and revenue. The last four are efficiency scores that turn green, orange, or red, so you can tell at a glance whether a route is worth running the way it is planned.
Included on Grow and Plus, or with the Routes add-on ($25/month).
Filling in the Numbers
Go to Schedule > Routes, tick the visits you want to include, and click Optimize / Save.
Most of the numbers sit blank as -- until the route is actually calculated, because they depend on how far you drive. Once the map draws your route, the whole strip fills in.
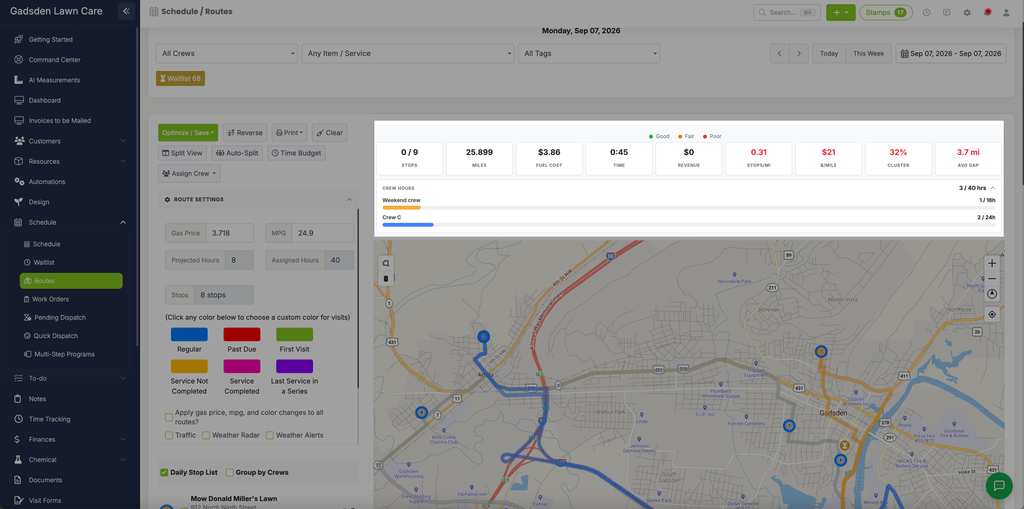
Your Day’s Totals
These five are straight facts about the day. They never change color.
Stops — how many stops are ticked, out of how many are scheduled that day. 8 / 9 means there are nine visits on the day and you have left one out of the route.
Miles — the total driving miles for the route. This includes driving from your start location out to the first stop and back to your end location at the end of the day, not just the distance between customers.
Fuel Cost — an estimate of the fuel for those miles, worked out from the Gas Price and MPG you set in Route Settings on the left side of the page. It is fuel only. It does not include wages, wear and tear, or anything else it costs you to run the day.
Time — this one means two different things depending on when you look at it:
- Before you optimize, it is the total budgeted hours of the visits you have ticked — how long the work itself should take.
- After you optimize, it is replaced by the driving time for the route. Driving time does not include the time your crew spends at each stop.
Revenue — the total price of the services on the ticked visits. This is what the day is worth if everything gets done and billed. It is not what has been paid.
Your Efficiency Scores
These four judge the route rather than describe it, so they are the ones that change color.
Stops/Mi — how many stops you get per mile driven. Higher is better. Two stops per mile means a tight neighborhood day; a quarter of a stop per mile means you are spending most of the day in the truck.
$/Mile — how much revenue each mile of driving earns you. Higher is better. This is the closest thing on the strip to “is this day worth running,” because it weighs what you are paid against how far you drive to get it.
Cluster — how tightly your stops are grouped, as a percentage. LawnPro looks at the average distance between each stop and the next one in your current order, then compares it to how far apart they would be if the same stops were spread evenly across the area they cover. 100% means you cannot do much better with the stops you have. A low number usually means one of two things: a stop or two sit far outside the group, or the order sends you doubling back across town.
Avg Gap — the average miles between one stop and the next. Lower is better.
Tip: Cluster is based on the order your stops are in, not just where they are. If it looks low, run Optimize / Save and check it again — reordering the same stops often moves it several points.
What Good, Fair, and Poor Mean
The green, orange, and red dots above the numbers are the key to the colors. They tell you how to read a value, and they only apply to the four efficiency scores:
| Score | Good (green) | Fair (orange) | Poor (red) |
|---|---|---|---|
| Stops/Mi | 1.0 or more | 0.5 to 0.99 | under 0.5 |
| $/Mile | $50 or more | $25 to $49 | under $25 |
| Cluster | 80% or more | 50% to 79% | under 50% |
| Avg Gap | 1 mile or less | 1 to 2 miles | over 2 miles |
Note that Avg Gap runs the other way from the rest — a small gap is a good thing, so it goes green when the number is low.
Stops, Miles, Fuel Cost, Time, and Revenue stay plain dark gray no matter what they say. There is no good or bad version of “$537.70 of revenue” on its own.
Crew Hours
Under the numbers is a bar showing how full the day is for your crew.
- Budgeted — the total budgeted hours of the visits you have ticked.
- Actual — the budgeted hours of the visits already marked complete. It is a progress figure: how much of the day’s planned work is finished.
- Available (shown as Capacity when one crew is selected) — how many hours that crew has for the day. This comes from the crew’s capacity setting, and is 8 hours if you have not set one.
The bar runs in your crew’s color, turns orange once the budgeted hours pass 90% of what the crew has available, and turns red with a warning symbol when the day is booked past capacity.
If you have All Crews selected rather than one crew, you get a separate row for each crew instead, so you can see which one is overloaded. Stops that are not assigned to any crew are left out of that view.
Common Questions
Why do most of the numbers show --?
The route has not been calculated yet. Miles, Fuel Cost, and the four efficiency scores all depend on the driving distance, so they stay blank until you click Optimize / Save and the route draws on the map.
Why did Time change after I optimized?
Because it switches from one measure to the other. Before you optimize it shows the budgeted hours for the work; afterwards it shows the driving time for the route. A day that reads 8:00:00 before and 1:45:00 after has not shrunk — you are now looking at the drive, not the work.
Does Fuel Cost include what I pay the crew?
No. It is only the estimated fuel, based on the gas price and MPG in Route Settings. Change either of those and the number changes with it.
Is Revenue money I have already collected?
No. It is the total price of the services on the ticked visits, whether or not they have been done, invoiced, or paid.
My stops all look close together, so why is Cluster low?
Cluster grades the order, not just the map. If the route runs from one side of town to the other and back again, the average hop between stops gets long even though every stop is nearby. It also drops when one stop sits well outside the rest, because that single long leg pulls the average up.
Can I change what counts as Good, Fair, or Poor?
No, the cutoffs are the same for every account and cannot be edited. Use them as a rough guide — what counts as a good day in a dense suburb is different from a rural route.
Why does Stops say 8 / 9?
Nine visits are scheduled for that day and eight of them are ticked into the route. Tick the last box in the stop list to pull the ninth one in, then optimize again.